Electrical Resistivity Monitoring Primer
Case Study: Electrical resistivity Monitoring applied to enhanced bioremediation at Brandywine, MD
Under a project sponsored by the Department of Defense ESTCP program a group of scientists from NAVFAC, USGS, PNNL and Subsurface Insights demonstrated the feasibility of monitoring amendment emplacement and subsequent behavior using electrical resistivity. This project (ER-0717: Optimized Enhanced Bioremediation through 4D Geophysical Monitoring and Autonomous Data Collection, Processing and Analysis) took place between 2008 and 2010.
The demonstration was designed to field validate the feasibility of monitoring amendment injection and subsequent behavior through automated electrical geophysical resistivity acquisition, processing and result delivery. This was done by deploying an electrical geophysical borehole and surface array as well as an associated sampling well array at the Brandywine DRMO in Brandywine, Maryland over an area where enhanced bioremediation was being conducted and collecting and processing timelapse electrical geophysical data.
During the demonstration three separate amendment injection events were monitored. The primary demonstration (which occurred from March 2008 through July 2010) involved the long term monitoring of a lactate based amendment which was injected as part of a site wide enhanced bioremediation effort. Two secondary demonstrations (done as part of a project extension) used the injection of molasses in August 2010 to demonstrate real time performance of the system. The first injection event and subsequent long term monitoring conclusively showed the ability of the monitoring to observe the initial emplacement and spatial distribution of the amendment as well as subsequent groundwater flow induced amendment dispersion. It also showed the sensitivity of the geophysical monitoring to processes associated with enhanced biological activity. The objective of the molasses injections was to demonstrate the real time capability. This was confirmed by project members, DoD and DOE staff who (both in the field and from remote locations) were able to observe the injection signature through a web site within 1 hour of amendment injection.
Site description
The former Brandywine Defense Reutilization and Marketing Office (DRMO) Yard (SS-01) is an inactive facility administratively controlled by Andrews AFB. The 8-acre site is approximately eight miles south-southeast of Andrews AFB in the town of Brandywine, MD.
While in operation from 1943-1987, the Brandywine DRMO yard was used for temporary storage of scrap materials and hazardous waste generated from various Department of Defense facilities in the region. The primary groundwater contaminant at the former DRMO site is trichloroethylene (TCE), a cleaning solvent. The plume has spread beyond the Air Force property into a residential neighborhood and commercial property. The primary soil contaminant is Polychlorinated Biphenyls (PCBs) and to a lesser extent metals and pesticides.
More detailed information on the Brandywine site can be found in the EPA NPL Site Narrative for the Brandywine DRMO site, and in the EPA ROD (Record of Decision) for the Brandywine DRMO.
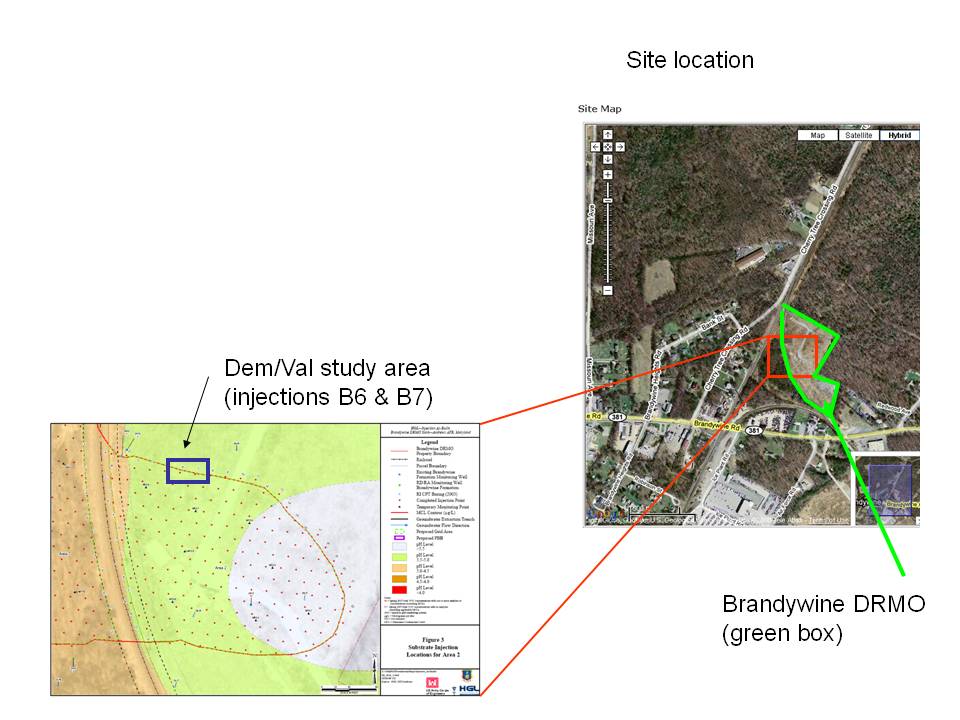
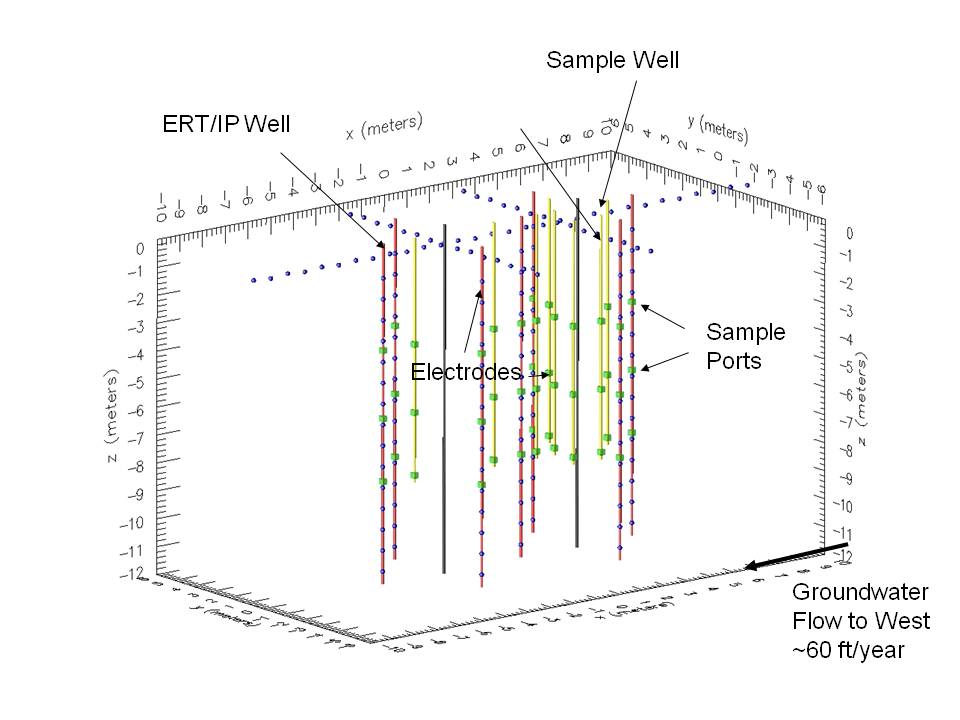
As part of the remedial effort at the site, it was decided to perform a bioremediation effort. For this, a large number of injections of the amendment (ABC, anaerobic biochem) were done in the spring of 2008. The project team designed the monitoring site and system to take advantage of these injections – specifically, to be able to monitor these geophysically. The image below shows the relative location of our system.
System setup
The monitoring system at the site consists of a series of sampling and ERT wells. The ERT wells have 15 electrodes each, spaced at 2 feet. The ERT wells also have sampling ports at 8,19 at 29 feet. The sampling wells have sampling ports at 8 and 19 feet, and a screen at the bottom of the well. In addition, there are 30 regular surface electrodes and 30 SP surface electrodes. The wells surround the two injection points which are being monitored by our system. In the summer of 2010 two surface lines were emplaced running roughly EW (100 m long) and NS (50 m long) to investigate the relative performance of surface vs borehole systems. A resistivity system used for autonomous monitoring was located in a shed adjacent to the site. Initially a single channel system was used, but for the injections in August 2010 an 8 channel system was used. Data was collected using a dedicated remotely accessible windows computer which transmitted the data to a server for data processing. The shed had dedicated 120 V AC power supplied to it to run all the electronics.
Long term monitoring results
The first monitored injections at the Brandywine site occurred on March 7, 2008. This injection occurred at injection point B6 and B7. The movie below shows the actual injection: the injection probe is pushed down to 34 feet, and lifted 1 feet at a time. At each depth about 30 gallon of amendment is injected.
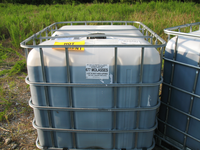
The mixture which was injected consists of 250 gallons of ABC + 3200 gallons of water + 466 lbs NaHCO3, which is about 7.8% of ABC. The mixing is done in a big truck tank.
The injection ranges from 34 to 8 ft bgs. 36 gallons of mixture was injected at each 1 ft interval. Each injection interval takes about 2-4 minutes. Each 36 gallons of mixture has about 2.6 gallons of ABC, 33.4 gallons of water. The mixture has a pH about 8.2 and the target pH is about 6 in the subsurface. The total injection volume for each injection site point is 27*36 = 972 gallons. Because during injection the watertable may rise to ground surface the injection rate maybe adjusted. The target is to get at least 70-75% of the total about 1000 gallons at each point. For our injection points, all the planned volume was injected.
This injection was monitored from March 2008 through August 2010. The animation below shows the change in electrical properties over time (compared to the background). For a more detailed description of how this data is interpreted (and some auxiliary data) please see this pdf of a 2010 Goldschmidt presentation.
Molasses injection monitoring
Two injections of about 400 gallons of molasses (mixed with about 600 gallons of water) occurred in August 2010. Both of these were monitored and reported on in real time. A dataset was collected every 28 minutes. Directly following the completion of the acquisition the data was transmitted to a server, processed on a HPC cluster, and the results were semi automatically posted on a website. The images below show the results of the injection