Electrical Resistivity Monitoring Primer
Data acquisition
Collection of electrical resistivity data in the field (or in a laboratory) requires a dedicated instrument known as a resistivity meter. While multiple research groups have built their own resistivity systems, in general users will use an commercially purchased instrument (see here for a list of different vendors). These instruments can be used to collect different kinds of surveys.
Instrument overview
Within resistivity systems there are different types and generations of instruments. These are
- Four electrode systems. These were the first generation of instruments. They can be used to take a standard electrical resistivity measurement.
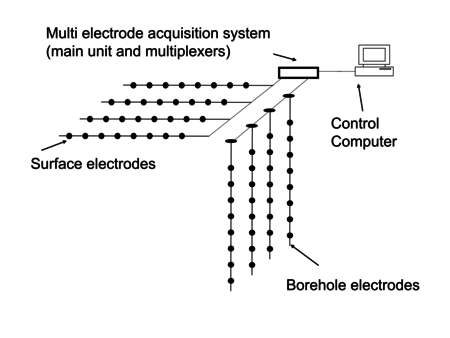
- Single channel, Multi electrode systems. These systems were developed in the 1990s, and add a multiplexer to four electrode systems so that a system can be hooked up to multiple electrodes at the same time and collects data on different electrode combinations without the need to manually move electrodes.
- Multi channel, multi electrode systems. These systems (which were introduced by different manufacturers around 2010) allow the collection of multiple potential measurements at the same time. They thus can speed up acquisition speed substantially.
Multi electrode systems require cables which connect the system to multiple electrodes. The most common design for these cables are multiconductor cables in which each cable is connected to an electrode. However, different cable designs exist.
Electrical resistivity systems are typically time domain systems which use a square wave, however there are some specialty frequency domain systems, as well as systems which can do both time domain and frequency domain measurements. In virtually all commercial systems we use a single current injection source, but (similar to medical imaging applications), multi source systems have been proposed.
Measurement geometries
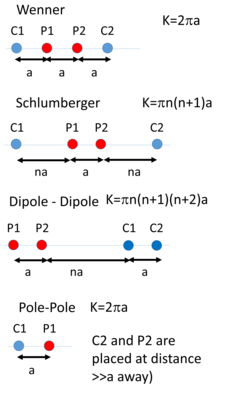
We can use different electrode geometries. Different common electrode geometries are typically used with different advantages in terms of signal/noise and vertical and horizontal resolution. Each measurement contains information about the subsurface. As is intuitively clear (and described in detail in a 1993 article by Xu and Noel ) using a certain number of electrodes we can take a finite number of independent measurements. Xu and Noel introduce the concept of complete datasets – datasets that have all possible independent measurements. Different equivalent complete datasets exists for all geometries. There are multiple papers and studies which discuss the sensitivity of different array types and the respective value of different arrays. This includes e.g. a a paper in Vadose Zone Journal by Furman et al (note that a pdf of this paper can be found on the internet through google scholar) and course notes from Loke on resistivity imaging.
Types of surveys
The term electrical resistivity survey is used both to refer to the process of data collection as well as the resulting measurements. Historically (until about the mid 1980s) data were collected using basic four electrode systems in modes known as profiling and sounding in which electrodes were moved manually. Since the early 1990s (enabled by improvements in instrumentation, and specifically the introduction of multi electrode systems) numerous other configurations have been developed. The main ones are
- Collection of 2D profiles using a linear array of electrodes located on the surface.
- Collection of data using 3D grids of electrodes
- Collection of data using electrodes placed along boreholes (either in a single borehole or in multiple boreholes)
- Collection of data with electrodes towed behind a boat (marine resistivity) or behind a vehicle using a landstreamer. This is a special case of the 2D profiles: basically at every position of the tow vehicle we collect a small 2D profile
- Collection of time-lapse data (also known as 4D data), which can be done using all the configurations listed above.
Sounding and profiling
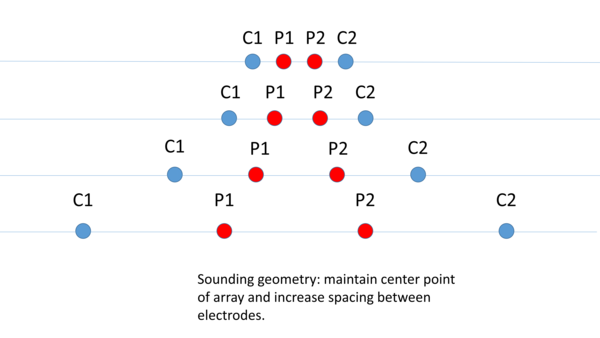
Sounding (also known as Vertical Electrical Sounding or VES) is a survey type which has as its objective to obtain a 1D distribution of resistivity with depth. Sounding is often contrasted with profiling, which has as its objective to obtain a distribution of the lateral distribution of resistivities. Of course, modern hardware typically can collects data which has both sounding and profiling information, but there is often still interest in VES surveys, specifically for water investigation studies.
In a VES study a symmetric array configuration is used – either a wenner or a schlumberger array. The midpoint of the array remains constant, but the size of the array increases. As the size increases, the depth to which the measurement is sensitive increases. The exact sensitivity depends on the distribution of electrical conductivities. Each measurement results in a value which can be plotted on a graph. Historically this graph was interpreted in terms of distributions of electrical properties by manual curve fitting, but nowadays numerous numerical codes exist which can do this.
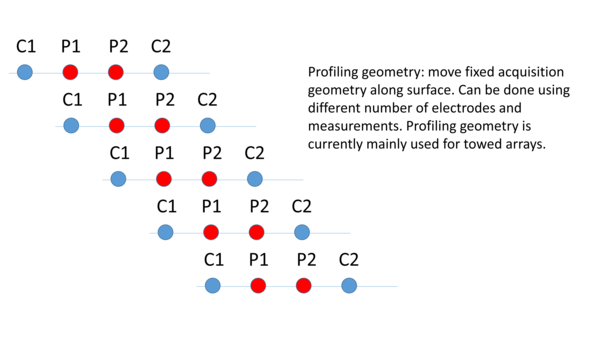
Profiling
2D (Linear) profiles
One popular survey type which is made possible by multi electrode instruments is the 2D profile. For a 2D profile we collect data using an array of generally equidistantly spaced electrodes laid out along a straight line on the surface. This configuration remains one of the most popular ones used to date. The reasons for this popularity are threefold:
- This kind of configuration can be easily collected (just set up a straight line with equally spaced electrodes) using current hardware;
- The data resulting from this kind of survey can be relatively easily processed on a standard PC using both commercial and open source resistivity processing software;
- The processed data looks like a fence diagram of electrical properties – something which is intuitively clear to interpreters. Note that the operative word here are “looks like”: unless the electrical properties are laterally invariant there will be 3D effects which need to be taken into consideration in the acquisition and processing, and ignoring this (as some processing codes do) can lead to artefacts. However, in many cases the resistivity profile is “sufficiently close” to a fence diagram that the advantage conferred by the 2D profile outweigh the inaccuracies.
3D surveys
While the majority of surveys uses 2D profiles there is an increase in 3D surveys where electrodes are placed in 3D grids along the surface and possibly in boreholes. While collecting and processing such surveys is substantially more involved than 2D surveys, 3D surveys provide substantial value as they can allow for better resolution of subsurface electrical property distributions than 2D surveys.